
The ContourPlot3D command provides one means to sketch the 3-dimensional graph of an equation of three variables. However, it is (necessarily) based on a cumbersome and slow procedure and so its preferable to use a different approach to sketching the surface when possible. If the equation can be solved for one of its variables ( for example, as z = f(x,y) ) then its better to use the Plot3D command. Or, if the surface can be described with a two-dimensional parametrization then the ParametricPlot3D command is better.
The ContourPlot3D command is in a special package which is not automatically loaded by MATHEMATICA. To use it you must first load the package by entering the command
(Warning: in this command the word ContourPlot3D is immediately preceded and immediately followed by a left quotation mark ` which does not show up very clearly in the HTML font used here.) If you try to implement the ContourPlot3D command before loading this graphics package with the << command, MATHEMATICA tends to get very confused. If this happens it may be necessary to exit and start a new MATHEMATICA session. Once the package is loaded, enter the command
This will draw the graph of f(x,y,z) = 0 ( which is the level surface for f(x,y,z) at C = 0 ) in the rectangular box [xmin,xmax] × [ymin,ymax] × [zmin,zmax] in 3-space. For example the output of
is the unit sphere centered at the origin:
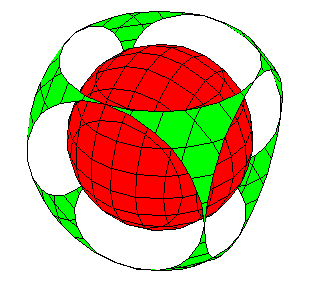
To take control of the output we might add some modifiers such as
obtaining two concentric spheres:
Here is a table of some modifiers which can be used.
| AmbientLight -> RGBColor[NN,NN,NN] | change the color of the surface |
| Axes -> BB | include or omit axes |
| AxesLabel -> {"text","text","text"} | label the axes |
| Background -> RGBColor[NN,NN,NN] | create a colored background |
| Boxed -> BB | include or omit box around figure |
| BoxRatios -> {NN, NN, NN} | specify the ratios of side lengths of the box (like setting the aspect ratio for a window) |
| Contours -> {NN, NN, ....} | specify NN, NN, .... as the precise level surfaces to graph |
| ContourStyle -> {{RGBColor[NN,NN,NN]}, {RGBColor[NN,NN,NN]}, ....} | specify the colors of the different level surfaces. This must be used with Lighting -> False |
| Lighting -> BB | use simulated lighting or not |
| PlotLabel -> "TEXT" | create a label for the contour plot |
| PlotPoints -> NN | number of points to sample. |
| SphericalRegion -> BB | this will keep the size of box constant when you change viewpoint |
| ViewPoint -> {NN,NN,NN} | coordinates of point from which to view box |
In this table, NN denotes a numerical value which must be between 0 and 1 in RGBColor. The symbol BB takes one of the values True or False .
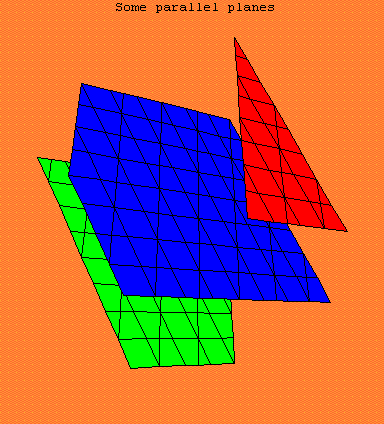
Here's one more example:
gives three parallel planes:
URL: http://math.ou.edu/~amiller/math/cplot3d.htm
August, 1999