The MATHEMATICA command for sketching vector fields is
PlotVectorField .
This command is in a special Graphics Package which is not automatically loaded by
MATHEMATICA. So to use it you must first load the Graphics Package by entering the command
<<Graphics`PlotField`
(SPECIAL NOTE: in this command the word PlotField
is immediately preceded and immediately followed by a left quotation mark
`
(which may not show up very clearly in the HTML font used on this web page).
There is no space before the first quotation mark.)
If you try to implement the PlotVectorField
command before you have successfully loaded the Graphics Package with the
<< command, MATHEMATICA tends to get very
confused. If this happens it is best to
exit and start a new MATHEMATICA session.
Once the Graphics Package is loaded, you may use the command
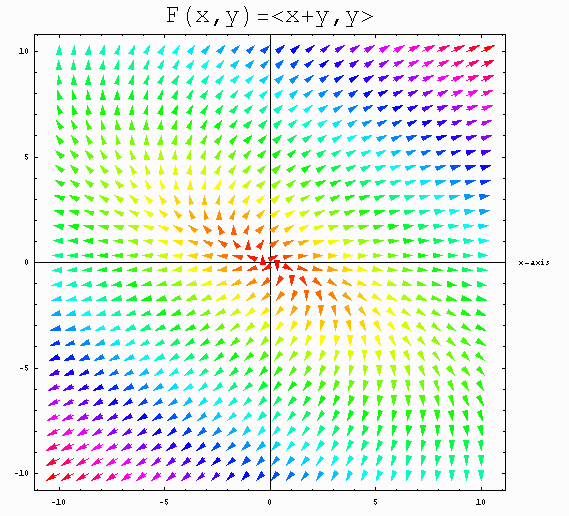
For example the output of the command

To get a more controlled output we might add some modifiers such as

Note that the modifier ColorFunction->Hue colors vectors with equal magnitude with the same color.
Many of the modifiers used for the ContourPlot command will also work for PlotVectorField. Others may be found in MATHEMATICA's HELP utility by searching under Graphics`PlotField`. Here are some useful ones:
| AspectRatio -> NN | set the aspect ratio to use in representing the viewing rectangle--the default is 1. |
| Axes -> BB | include or omit axes |
| AxesLabel -> {"text","text"} | label the axes |
| ColorFunction -> Hue | color the vectors as a function of magnitude |
| PlotLabel -> "TEXT" | create a label for the vector field plot |
| PlotPoints -> NN | number of points in each direction at which to draw vectors. The default is NN=15. |
| ScaleFactor -> NN | scales the magnitudes of displayed vectors--the default is NN=1. |
| HeadWidth -> NN | controls the size of the heads of the vectors--the default is NN=.5. |
| HeadCenter -> NN | controls the shape of the heads of the vectors--the default is NN=1. |
| HeadLength -> NN | allows more controls of the shape of the heads of the vectors. (Usually NN would be a very small positive number such as NN=.007) |
In this table, NN denotes a numerical value, and the symbol BB takes one of the values True or False.
Here's an example showing how one might combine PlotVectorField with other graphics commands. This particular example displays a contour map for the function of two variables f(x,y) = x^2 - y^2 with its gradient vector field superimposed. Of course the gradient vector field is orthogonal to the family contour curves for the function.

Special commands are available for plotting gradient vector fields and Hamiltonian vector fields:

It is also possible to have MATHEMTICA sketch 3-dimensional vector fields. For this
you must first load the Graphics Package PlotField3D
by entering
<<Graphics`PlotField3D`
Now use the command


URL: http://math.ou.edu/~amiller/math/vfield.htm
November, 1999