The basic command for sketching level curves for a real-valued function of two variables in MATHEMATICA is
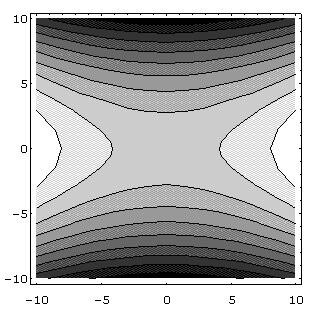
which will draw level curves for z=f(x,y) in the rectangle [xmin,xmax] × [ymin,ymax] in the xy-plane. For example the output of
is:
To get a more controlled output we might add some modifiers such as
obtaining:

Here is a table of some useful modifiers which are available.
| AspectRatio -> NN | set the aspect ratio to use in representing the viewing rectangle--the default is 1. |
| Axes -> BB | include or omit axes |
| AxesLabel -> {"text","text"} | label the axes |
| ColorFunction -> Hue | color the output as a function of height |
| Contours -> NN | set NN as the number of level curves to be drawn |
| Contours -> {NN, NN, ....} | specify NN, NN, .... as the precise level curves to graph. |
| PlotLabel -> "TEXT" | create a label for the contour plot |
| PlotPoints -> NN | number of points in each direction to sample. Raising this number will give more resolution in the picture. The default is NN=15. |
| ContourShading -> BB | include or omit the shading--the default is to include it. |
In this table, NN denotes a numerical value, and the symbol BB takes one of the values True or False.
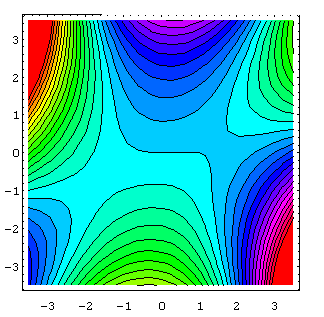
Here's one last example
gives
URL: http://math.ou.edu/~amiller/math/contplot.htm
August, 1999