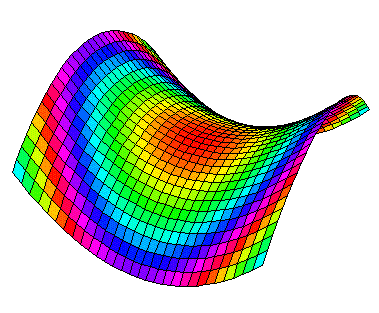
The basic command for sketching the graph of a real-valued function of two variables with MATHEMATICA
will draw the graph of z = f(x,y) over the rectangle [xmin,xmax] × [ymin,ymax] in the xy-plane. For example the output of
is:

Here is a table of some modifiers which you may find useful to take more control of the output.
| Axes -> BB | include or omit axes |
| AxesLabel -> {"text","text","text"} | label axes |
| Boxed -> BB | include or omit box around figure |
| BoxRatios -> {NN, NN, NN} | specify the ratios of side lengths of the box (like setting the aspect ratio for a window) |
| ClipFill -> None | omit all parts of the surface which don't lie inside the viewing box |
| ColorFunction -> Hue | color the output as a function of height |
| Lighting -> BB | use simulated lighting or not |
| PlotPoints -> NN | number of points in each direction to sample. Raising this number will give a more accurate picture. The default is NN=15. |
| PlotRange -> {NN, NN} | set vertical coordinates of viewing box |
| Shading -> BB | color the surface or not |
| SphericalRegion -> BB | this will keep the size of box constant when you change viewpoint |
| ViewPoint -> {NN,NN,NN} | coordinates of point from which to view box |
In this table, NN denotes a numerical value, and the symbol BB takes one of the values True or False.
A viewpoint can be chosen interactively by going into the Action menu at the top of the screen, and then choosing the Prepare Input and 3D ViewPoint Selector (or just the shortkey Shift-Control-v). Now move the box around to the position you want to view from and then click on Paste to save it to your workspace.
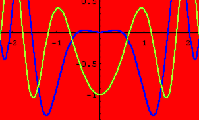
If you would like to take more control of the coloring of the surface you could try using a variation on the basic Plot3D command.
which will draw the graph of z=f(x,y) over the rectangle [xmin,xmax] × [ymin,ymax] in the xy-plane, and with shading controlled by SS. For example,
sets the colors on the graph as a function of .03*(x^2+y^2):


URL: http://math.ou.edu/~amiller/math/plot3d.htm
August, 1999