The basic command in MATHEMATICA for sketching the graph of a surface described by parametric equations is:
This will sketch the surface with parametric equations
        x = f(u,v)
        y = g(u,v)
        z = h(u,v)
as (u,v) ranges through the rectangle [umin,umax] × [vmin,vmax]
in the uv-plane.
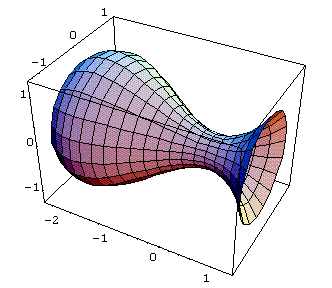
For example the output of
is the surface of revolution:

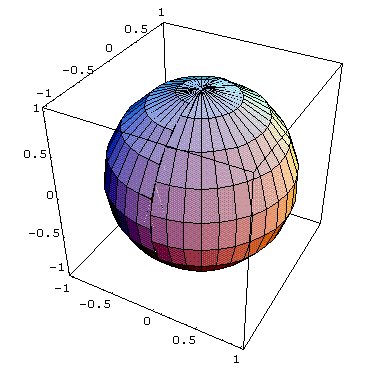
and the output of
is the unit sphere centered at the origin:
Here is a table of some modifiers which can be used.
| AmbientLight -> RGBColor[NN,NN,NN] | change color of the surface |
| Axes -> BB | include or omit axes |
| Background -> RGBColor[NN,NN,NN] | create a colored background |
| Boxed -> BB | include or omit box around figure |
| BoxRatios -> {NN, NN, NN} | specify the ratios of side lengths of the box (like setting the aspect ratio for a window) |
| Lighting -> BB | use simulated lighting or not |
| PlotLabel -> "TEXT" | create a label for the contour plot |
| PlotPoints -> NN | number of points in each direction to sample. Raising this number will give a more accurate picture. |
| SphericalRegion -> BB | this will keep the size of box constant when you change viewpoint |
| ViewPoint -> {NN,NN,NN} | coordinates of point from which to view box |
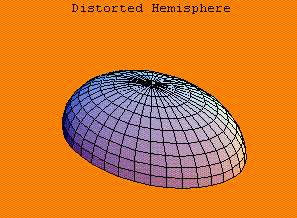
In this table, NN denotes a numerical value ( for RGBColor, the numbers NN should be between 0 and 1 ). The symbol BB takes one of the values True or False. To illustrate:
will produce the graph:
To take more control of the coloring of the surface one can try using a variation on the basic ParametricPlot3D command:
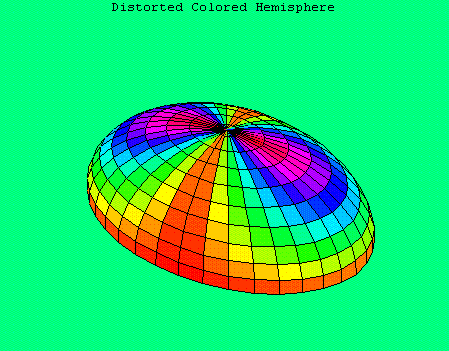
which will draw the parametrized surface over the rectangle [umin,umax] × [vmin,vmax] in the uv-plane, and with shading controlled by SS. To make this work you will also need to set Lighting -> False. For example,
sets the colors on the graph as a function of sin(v)sin(u):
URL: http://math.ou.edu/~amiller/math/pplot3d.htm
August, 1999