Limits and derivatives Question 4 Details
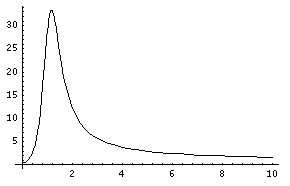
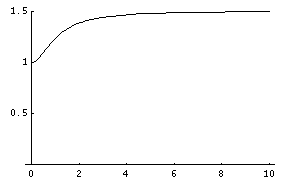
a). If you plot the graph you should get something like:
Using the trace key and going
a long way
to the right you should get that the limit is 0.75. For a
numerical approach, put


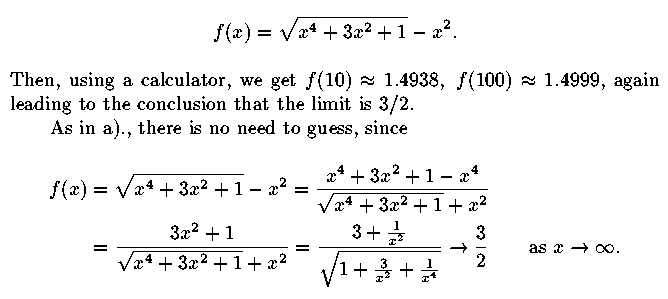
b). If you plot the graph you should get something like:

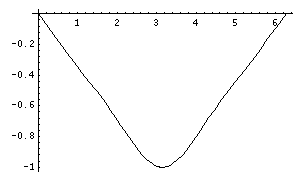
c). If you plot the graph you should get something like:

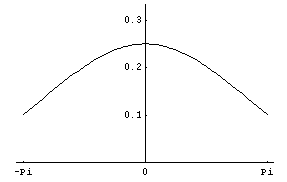
d). If you plot the graph you should get something like:
